Vacant dwellings in the Municipality of Athens: spatial dynamics, methodological challenges and reactivation policies to address the housing crisis
Siatitsa Dimitra
Built Environment, Housing
2026 | Feb
This article examines the geography, characteristics and temporalities of vacant dwellings in the Municipality of Athens, drawing on two primary data sources: (a) the Hellenic Statistical Authority (ELSTAT) Population-Housing Census (2011 and 2021), and (b) the HEDNO (Hellenic Electricity Distribution Network Operator) registry of non-electrified (N.E.) properties (September 2024 and 2025). The aim is, on the one hand, to develop a more nuanced understanding of the scale and forms of vacancy across different neighbourhoods of the city and, on the other, to contribute to the policy debate on mobilising the vacant housing stock within the framework of social housing policies.
The article argues that the activation of vacant dwellings cannot be achieved through horizontal, centrally administered measures. Instead, it should be embedded in locally grounded housing strategies, developed in synergy with local urban planning frameworks. The quantitative and spatial analysis of available datasets constitutes a starting point for a broader methodological approach, which requires complementary targeted qualitative and field-based research, as well as the creation of a Housing Observatory for the systematic monitoring of property conditions, housing market dynamics and residents’ housing needs.
Reframing vacancy in contemporary housing policy
Vacant dwellings are a structural feature of real estate markets across Europe. Increasingly, they are associated with speculative practices and investment strategies of capital, but also with the specificities and historical trajectories of built environment production, as well as with public policies in each local context. A range of studies propose different typologies of vacancy: according to duration out of use (FEANTSA 2016), property condition and use (Caramaschi & Chiodelli 2022), or the processes through which vacant properties are produced, maintained and removed in relation to owners’ strategies and the role of the state (O’Callaghan 2023). These typologies provide an analytical framework for understanding a complex phenomenon and can inform more nuanced policy responses, moving beyond simplified interpretations that treat vacant properties merely as a supply-demand imbalance, detached from social relations, property regimes and dynamics of urban restructuring.
At the European level, the mobilisation of underused and inactive building stock has become a central policy direction in the recommendations of organisations such as FEANTSA, Housing Europe and the Urban Agenda, and more recently within the objectives of the European Affordable Housing Plan in addressing the housing crisis [1]. This concerns not only residential properties but also commercial or former industrial buildings that could be repurposed into housing. The reuse of vacant properties is promoted as a more sustainable alternative to new construction, alongside methodologies for mapping, classifying and assessing vacant dwellings in line with goals of energy retrofitting, sustainable development and equitable access to housing.
Recently, the issue of vacancy has moved to the forefront of public debate and housing policy also in Greece, linked to the intensification of the housing crisis, rising rents, the expansion of short-term rentals and post-crisis urban transformation dynamics. Policy responses have largely focused on horizontal incentive schemes -grants and tax exemptions for owners of vacant dwellings aimed at “returning” them to the market- without substantial results. Beyond the need to strengthen the social conditionality of public support, particularly regarding rent levels and long-term use, there is a pressing need for systematic analysis of the geography, characteristics and ownership structure of vacant dwellings, as well as of the differentiated reasons why a significant share of the housing stock remains outside the market despite high demand.
The “Mediterranean paradox” and the spatial dynamics of vacant dwellings in Greece
The large number of vacant dwellings in Southern European metropolises such as Athens is not a recent phenomenon. The “Mediterranean paradox” -the coexistence of a substantial stock of unused properties alongside high demand and rising housing prices- has been identified for decades as a distinctive feature of Southern European housing systems (see, indicatively, Hoekstra & Vakili Zad 2006). High vacancy rates are associated with the touristic and second-home character of Mediterranean countries, the central role of construction in their economies, the prevalence of small-scale ownership, the importance of family property, and the historically pivotal role of real estate in processes of social reproduction.
In Athens, numerous studies have examined vacant properties; both residential (Maloutas 2000; Maloutas & Spyrellis, 2015; Αράπογλου κ.ά., 2019; Αράπογλου & Σιατίτσα, 2019; Dimitrakou, 2021) and non-residential (Triantafyllopoulos 2015; Belavilas & Prentou 2015). Similar research in Thessaloniki has identified comparable patterns and dynamics producing vacancy (Chatziprokopiou et al. 2024; 2025; Vrantsis 2025). These studies highlight the relationship between the spatial concentration and timing of vacant dwellings and broader processes of investment and disinvestment, real estate cycles, public policies, demographic and urban change, as well as the social relations and household practices structured around property ownership. Understanding vacancy requires combining various datasets and research methods, an increasingly necessary approach in Greece, where fragmented small ownership, accumulation by investment funds and REITs, inactive public properties and inheritance renunciations together shape a highly complex field of property regimes and uses. An effort that is further hindered by the lack of transparency in the real estate market and the absence of systematic public monitoring mechanisms.
The significant increase in vacant dwellings in central areas of Athens during 2001-2011 (reaching up to 200% in some neighbourhoods; see Table 3) has been attributed to wider metropolitan restructuring processes: suburbanisation, long-term population decline (since the 1980s; see Table 2), and reduced demand linked to declining purchasing power in these areas (Maloutas & Spyrellis 2015). It has also been associated with structural characteristics of the Greek property regime, such as fragmented and multiple ownership, while disinvestment during the economic crisis contributed to further abandonment (Triantafyllopoulos 2015).
Photos 1-7: Vacant Dwellings in Athens
This article revisits the phenomenon using data from the 2021 Census and complements them with data on non-electrified residential properties, employed as a proxy indicator of vacancy, following a similar approach to that adopted by Chatziprokopiou et al. (2024) for Thessaloniki. Since each data source constructs the object of analysis differently, the article highlights both the methodological limitations and the distinct interpretative potentials of the two approaches [2]. It focuses on the quantitative and spatial mapping of vacant dwellings in the Municipality of Athens, as well as on their temporalities and characteristics, treating vacancy not as a static category but as a process shaped over time through intertwined social, economic and institutional dynamics.
Vacant Dwellings in the Municipality of Athens Based on the Census (2011-2021)
Housing censuses conducted every ten years constitute the most common reference source for vacant dwellings. Vacant dwellings are recorded as conventional dwellings that do not constitute the principal usual residence of any person at the time of the census, for various reasons [3].
In 2021, 437.188 conventional dwellings were recorded (only 9.363 more than a decade earlier), of which 117.137 were vacant (26,8% of the housing stock), located predominantly in apartment buildings (94,6%). Of these, 49.837 (42,5%) were for rent [4] and 7.176 (6,1%) for sale, while 34.842 (29,7%) were recorded as secondary residences, 869 (0,7%) as holiday homes, and 24.215 (20,8%) were vacant for other reasons. As in other Southern European Mediterranean metropolises, a high proportion of both seasonal and occasional non-use of residential property is recorded, indicating systematic underutilisation of the available housing stock [5].
Table 1. Vacant dwellings in the Municipality of Athens by category of non-use, 2011–2021
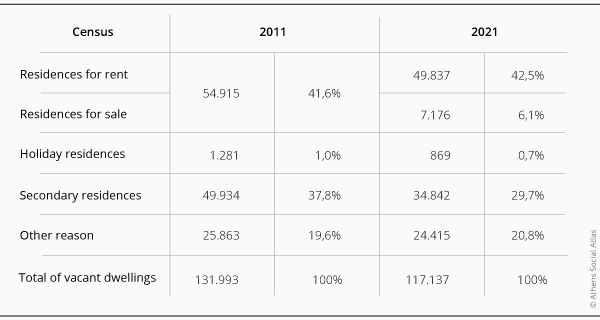
Source: ELSTAT censuses 2011 & 2021
Overall, during the period 1991-2021, Athens experienced significant demographic decline (particularly in the decade 2001-2011), combined with an increase in the number of households and in the housing stock (especially during 2001-2011) (Table 2). Vacant dwellings peaked in 2011 and decreased in the decade 2011-2021, while remaining at high levels [6].
Table 2: Population, households and conventional dwellings in the Municipality of Athens, 1991–2021
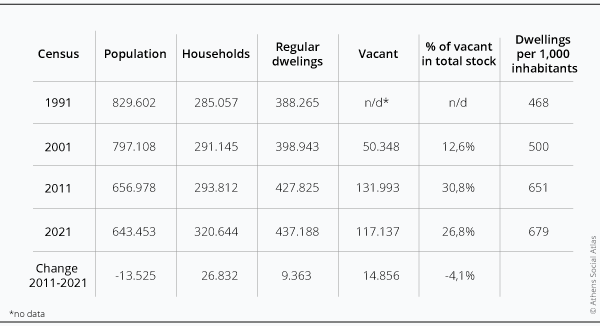
Source: ELSTAT, Censuses 2021, Panorama ELSTAT/ΕΚΚΕ on census 2001 &1991
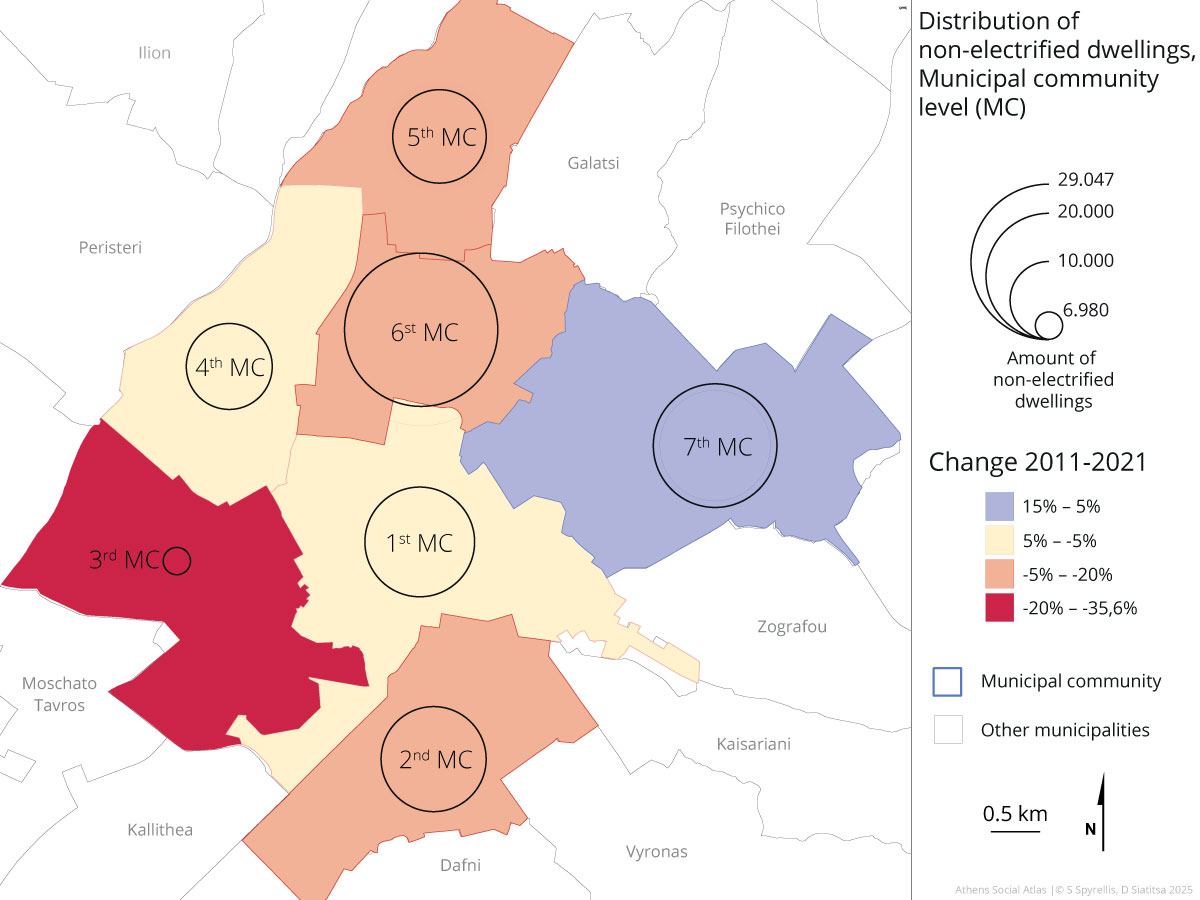
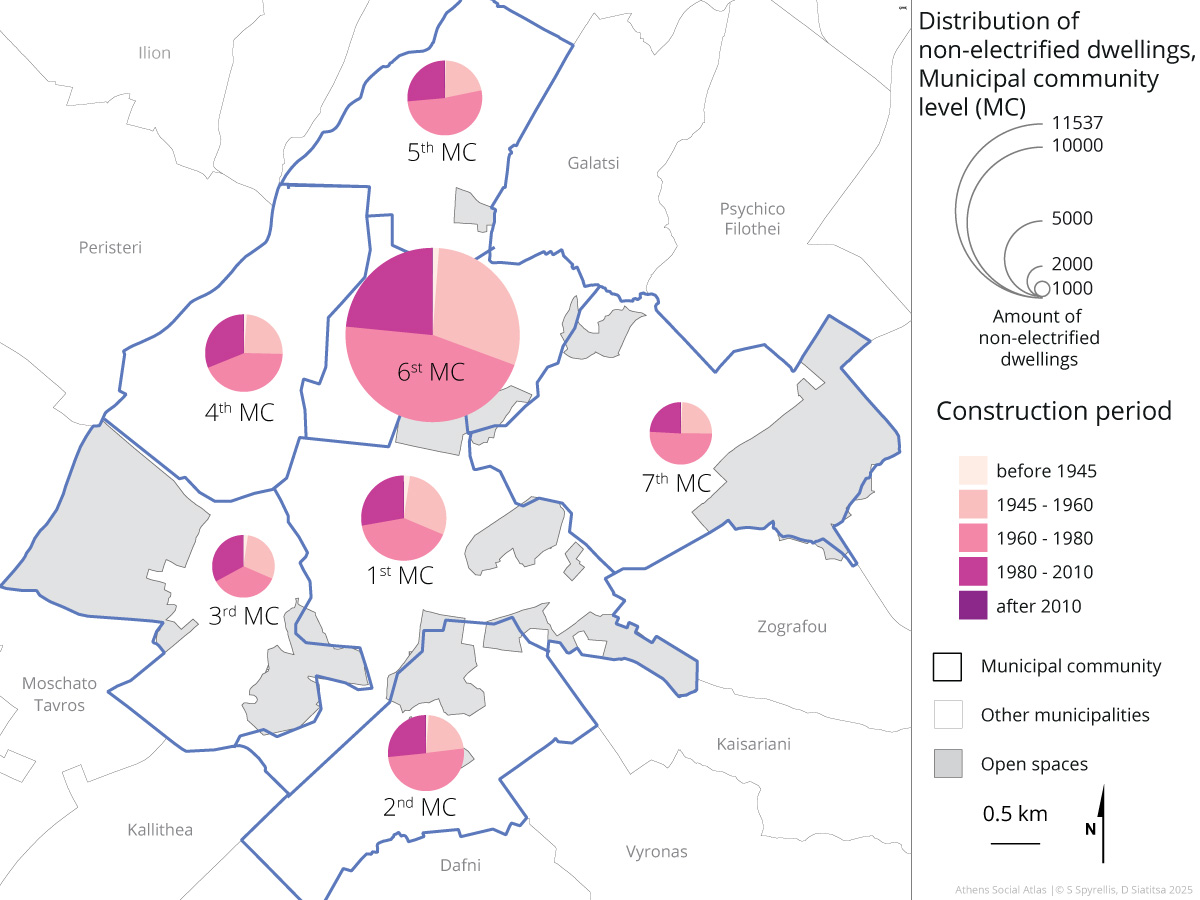
With regard to spatial distribution across the seven Municipal Communities (Table 3, Figure 1), the 6th Community (Patissia, Kypseli) recorded in 2021 the highest number of vacant dwellings (in both absolute and relative terms), linked to its large housing stock and the significant increase in vacancy observed during the previous decade in the area. High concentrations are also recorded in the 7th (Ampelokipoi, Polygono) and 2nd (Pangrati, Neos Kosmos) Communities, while in the 1st (City Centre, Kolonaki, Exarchia, Koukaki) the high proportion of vacant dwellings is also associated with the strong presence of commercial and professional uses.
Table 3: Vacant and conventional dwellings by Municipal Community, 2021, and change 2011–2021
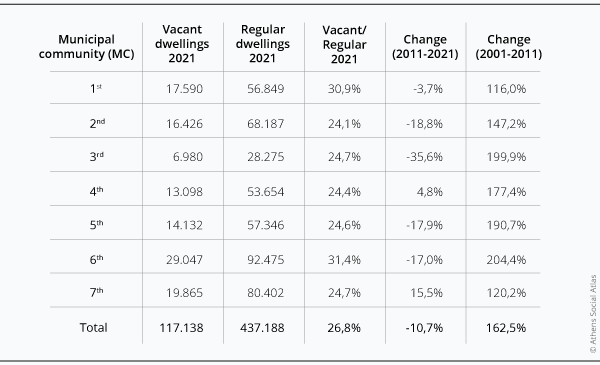
Source: ELSTAT census 2021, Panorama ELSTAT/ΕΚΚΕ on census 2001 &1991
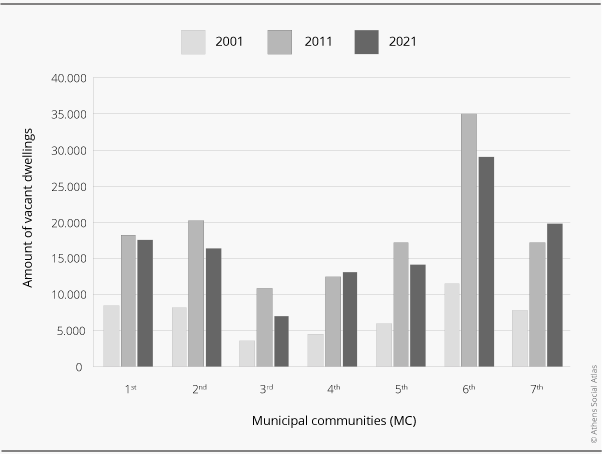
Figure 1. Number of vacant dwellings by Municipal Community per decade (2001–2021)
With the exception of the 7th Community, where vacant dwellings increased by 15,5%, and the 4th, which recorded a smaller increase of approximately 5%, it appears that during the period 2011-2021 a significant share of vacant dwellings returned to use, possibly covering -together with newly built units- part of the demand generated by the increase in households in the Municipality. However, this assessment must also take into account dwellings that shifted from conventional residential use to tourist or short-/medium-term rental use, as well as vacant dwellings converted into tourist accommodation, a process that is difficult to capture due to statistical ambiguities and definitional and recording limitations in the census categories.
The significant change in the 3rd Municipal Community (Petralona, Thiseio, Votanikos, Gazi) may be explained by the comparatively small size of its housing stock, but also by patterns of abandonment and underinvestment in the previous decade, in anticipation of more profitable upgrading dynamics, as well as by the extensive development of leisure and tourism-related uses. The 2nd and 6th Communities lie at the centre of gentrification and touristification trends in central neighbourhoods, while the reduction of vacant dwellings in the 5th Community (Ano Patissia, Rizoupoli) may be associated with the displacement of residents from more central areas. In the 1st Community, despite the high concentration of tourist accommodation and investment activity, the limited change may reflect the shift of dwellings from vacancy to short-term rental use. More robust conclusions, however, require further field-based and in-depth research.
Map 1. Change 2011–2021 and number of vacant dwellings by Municipal Community
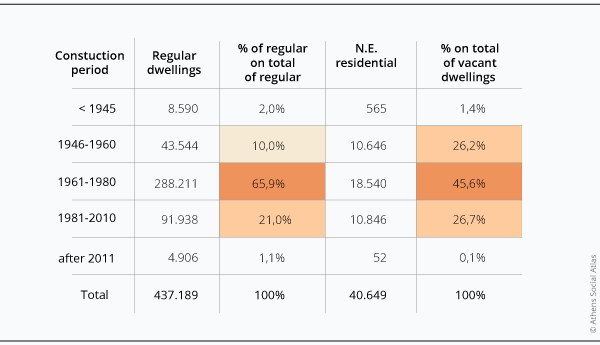
The age of vacant dwellings constitutes a critical factor, as it is associated with the high cost of rehabilitation and energy upgrading that may be required for their reuse. 82% of vacant apartments are located in buildings constructed during the period 1946-1980, particularly during the phase of mass apartment-block production under the antiparochi system (1960-1980) (Table 4). The high proportion of vacancy in more recently constructed buildings also requires further investigation. Although new housing production -as reflected in the census- is relatively limited compared to demand, a substantial share of the newly built stock does not enter into use. This may be related either to the very high sale and rental prices of newly built dwellings or to the profile of their purchasers, who may have investment-oriented motives (e.g. golden visa schemes).
Table 4. Construction period of vacant dwellings in relation to the total housing stock

Source: Census 2021
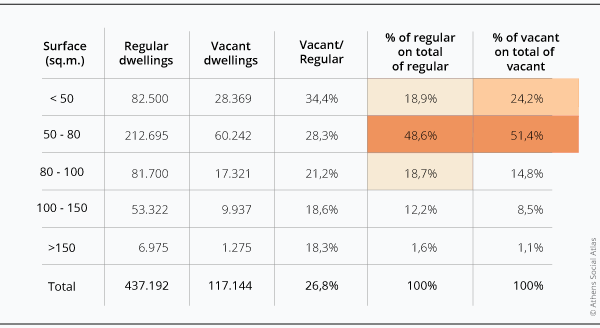
With regard to the size of vacant dwellings, half range between 50 and 80 sq.m., in proportion to the overall housing stock, while a significant share is also found in dwellings below 50 sq.m. This category may correspond to a comparatively more devalued segment of the housing stock, given that in the typical antiparochi apartment-building model that dominates the Municipality of Athens, smaller dwellings are generally located on the lower floors, which have historically been associated with lower value and lower housing quality (see Figure 1; Maloutas & Spyrellis, 2015).
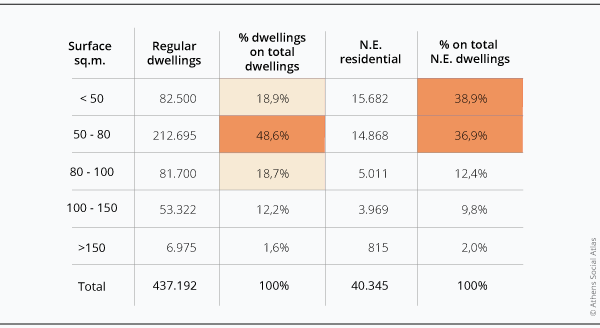
Table 5. Size of vacant dwellings in relation to the total housing stock
Source: Census 2021
Vacant Dwellings in the Municipality of Athens Based on HEDNO Data (2024–2025)
Non-electrified properties constitute a critical complementary source, as the absence of electricity connection is directly associated with actual non-use, in contrast to ELSTAT categories, a large share of which may involve occasional or seasonal use. They therefore provide a more reliable indication of vacant properties, given that almost all non-electrified properties are vacant, although not all vacant properties are non-electrified. This indicator underestimates the overall scale of the phenomenon but can capture its minimum extent with relative accuracy.
The HEDNO database provides information on properties that remain disconnected from the electricity network at the date of data extraction [7]. The following analysis examines the concentrations and spatial distribution of non-electrified properties in the Municipality of Athens by use (former residential or commercial), the duration of disconnection, as well as the size and age of these properties. According to data from September 2025 (Table 6), a total of 622.849 electricity connections were recorded in the Municipality of Athens, of which 81,7% were residential and 18,3% commercial [8]. Of these, 11,7% were disconnected. The share of non-electrified properties is considerably higher among commercial uses, with nearly one in three properties disconnected, while the corresponding rate for residential connections is 7,7%, significantly lower than the 26,8% of vacant dwellings recorded by ELSTAT in 2021.
Table 6. Electrified and non-electrified properties by use
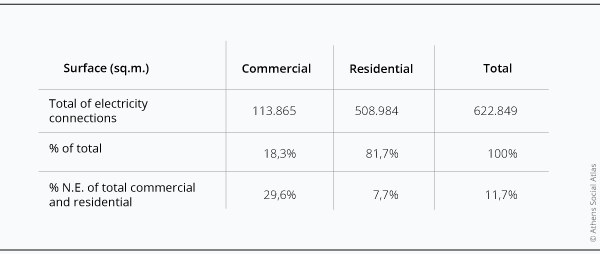
Source: Municipality of Athens (HEDNO data), September 2025
The total number of non-electrified properties in September 2025 amounted to 75.289, representing an increase of 11,9% compared to September 2024 (Table 7). This increase is significantly influenced by the large number of disconnections recorded during the first nine months of 2025 (13.837 disconnections) [9] of which 81% concerned residential properties and correspond to 27,5% of all non-electrified residential properties. If the new disconnections carried out in 2025 are excluded, the properties that were already disconnected in 2024 show an overall decrease of 8,7% between 2024 and 2025. Reconnection appears to be more immediate for residential properties (12,9%) compared to commercial ones (4,3%).
Table 7. Change in non-electrified properties, September 2024–2025
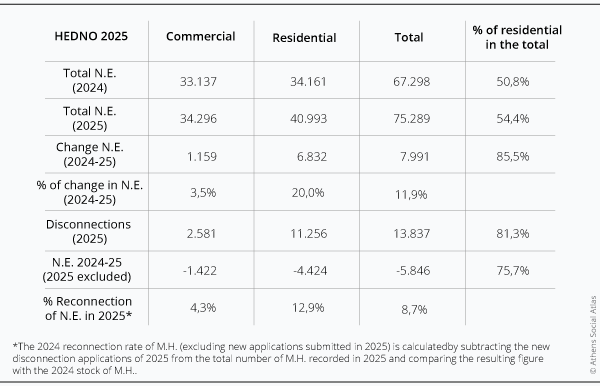
Source: Municipality of Athens (HEDNO data)
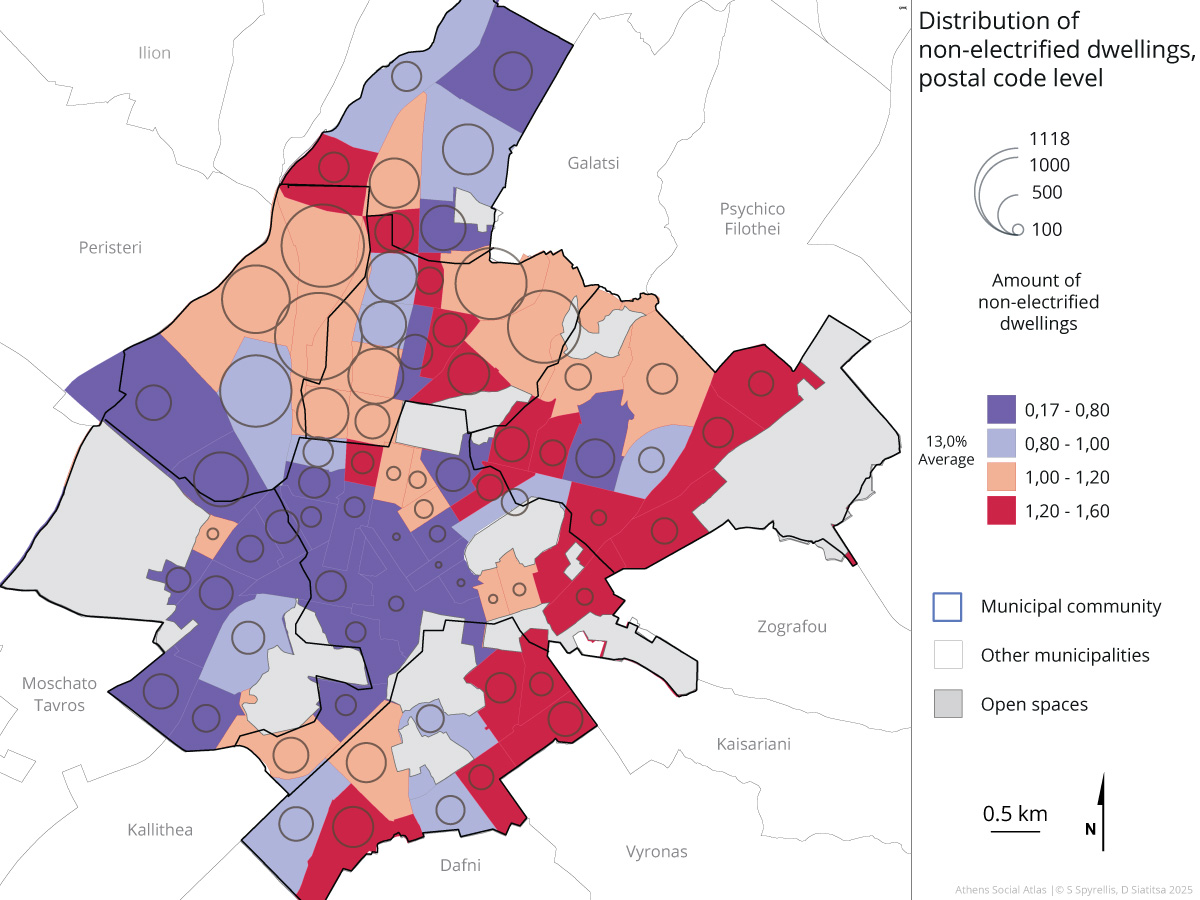
With regard to the geographical distribution of vacant non-electrified residential properties, 28,46% (11.579) are located in the 6th Municipal Community, while the remainder are distributed relatively evenly across the other Communities (Table 8, Maps 2 & 3). When examined in relation to the housing stock (conventional dwellings in the 2021 Census), the highest proportions are recorded in the 3rd (14,7%) and 6th (12,52%) Communities, while the lowest share of non-electrified residential properties is found in the 7th (5,15%). The 1st Community concentrates 25,9% of non-electrified commercial properties, followed by the 3rd, 2nd and 6th.
Table 8. Spatial distribution of non-electrified properties by Municipal Community
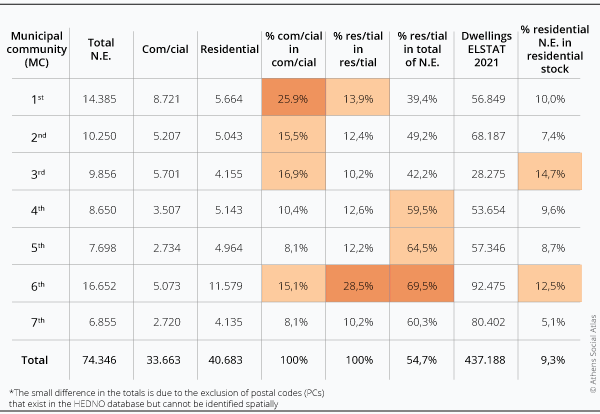
Source: Municipality of Athens (HEDNO data), September 2025, and ELSTAT 2021
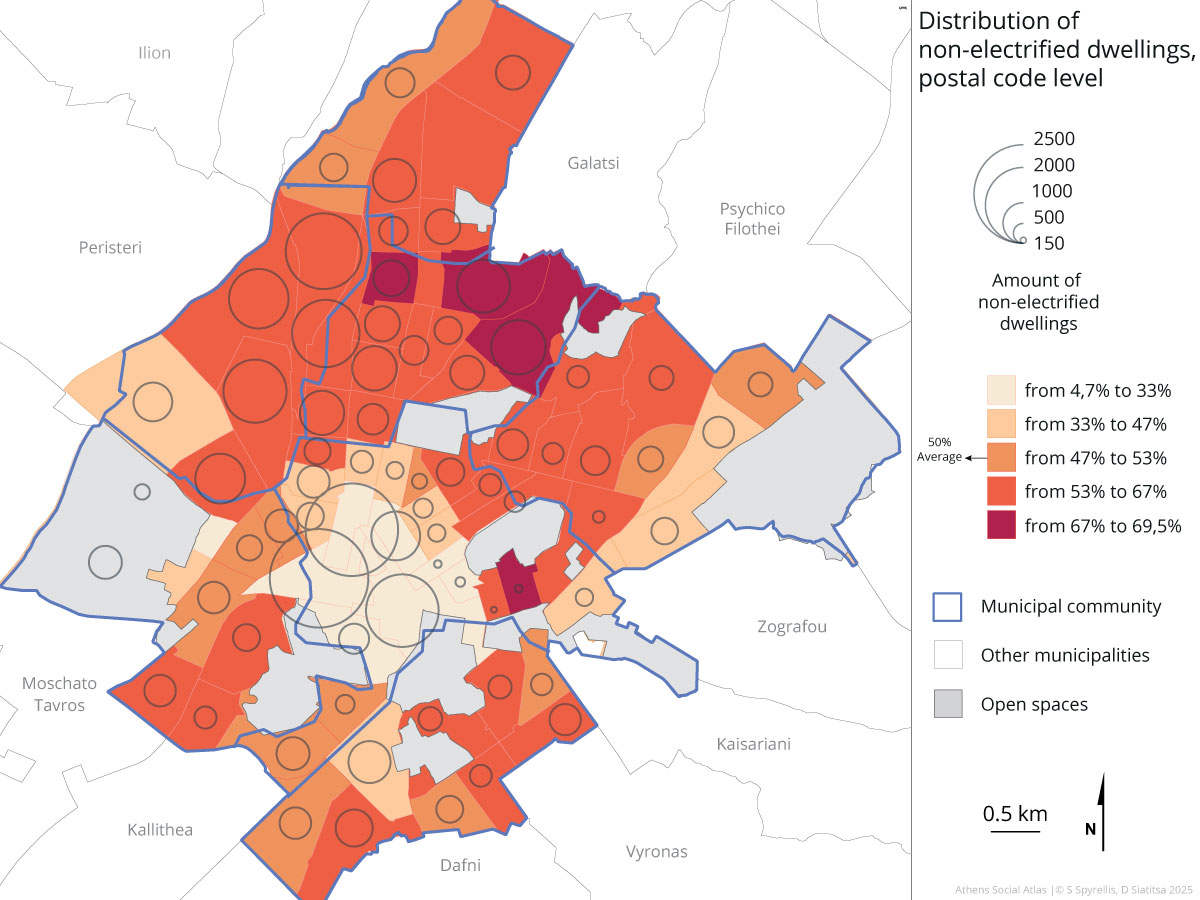
Map 2 presents the spatial distribution of the share of residential non-electrified properties within the total number of non-electrified properties, as well as the absolute number of non-electrified properties at postal code (PC) level. On average, half of the non-electrified properties were residential. This share is lower in areas with a higher concentration of commercial properties and vice versa, while it is also influenced by the total number of non-electrified properties in each postal code area.
Map 2: Share of residential properties within the total number of non-electrified properties and number of non-electrified properties by postal code
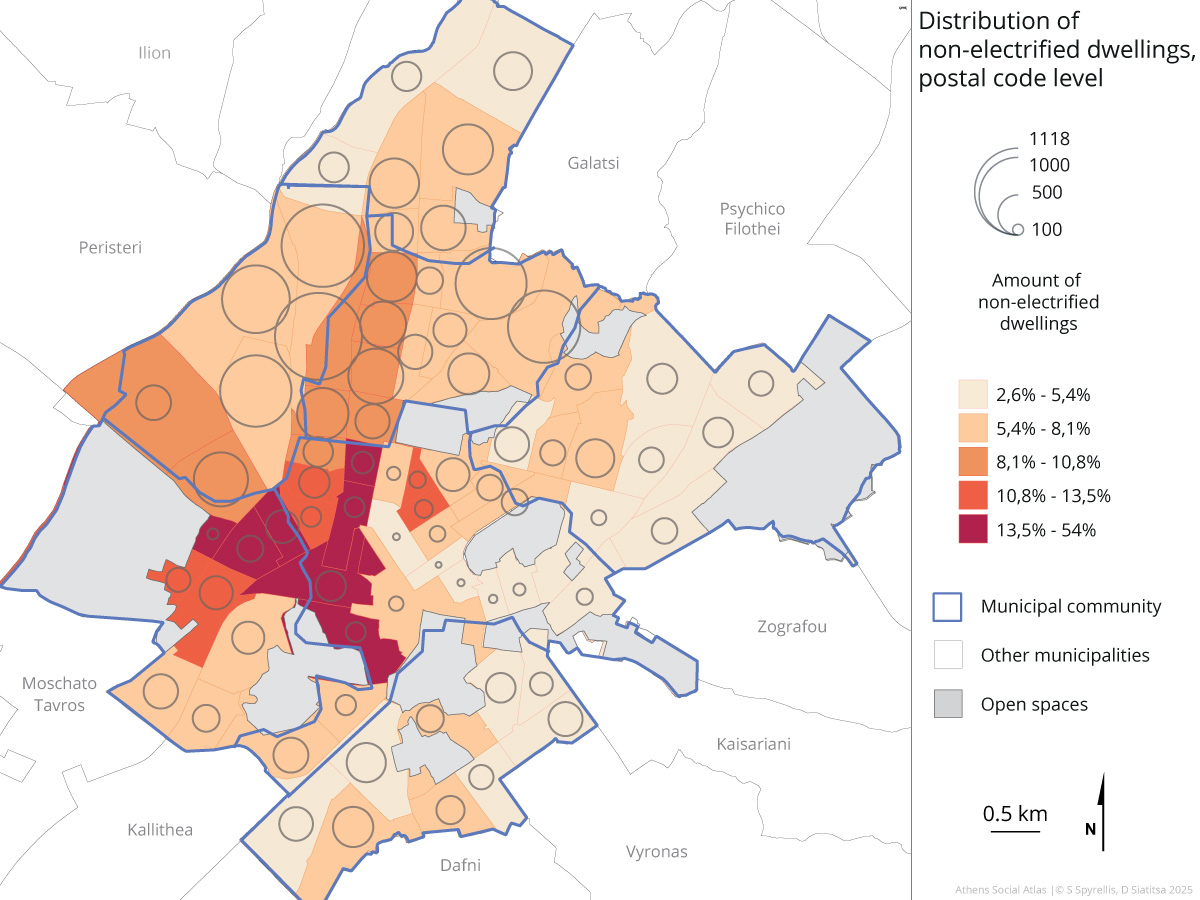
The picture changes when examining the total number of residential non-electrified properties in relation to the housing stock (Map 3). The proportion appears higher in areas of the 1st and 3rd Municipal Communities, where residential use has historically been less developed -such as the historic and commercial centre- or in areas with a relatively small number of dwellings and conditions of degradation and disinvestment, including Metaxourgeio and Gazi, as well as areas around Omonia.
Map 3: Share of residential non-electrified properties in relation to the ELSTAT 2021 conventional housing stock and number of residential non-electrified properties by postal code
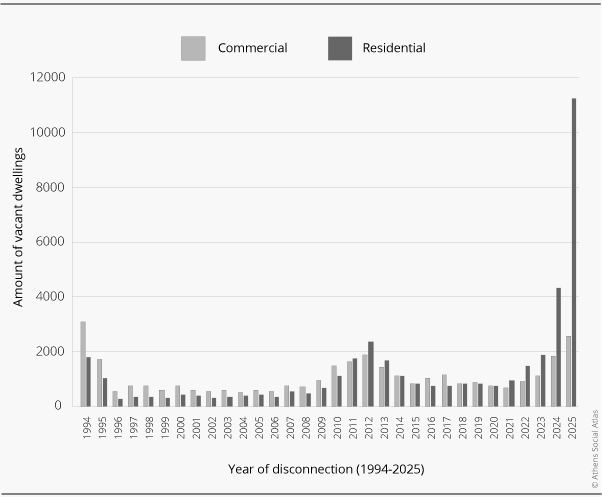
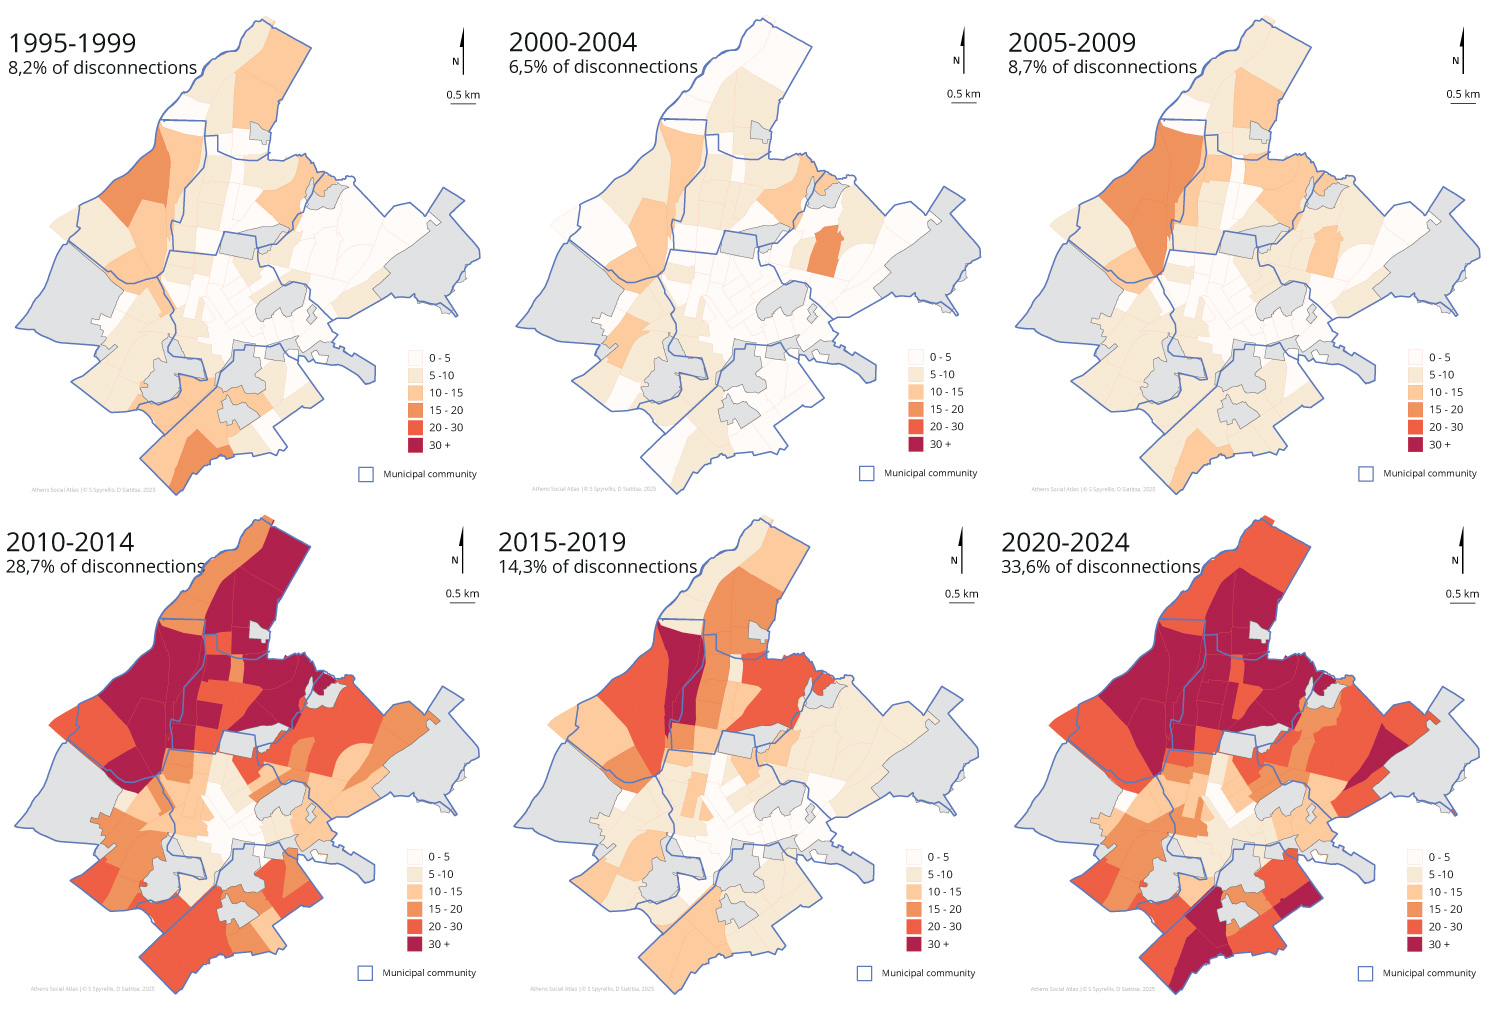
The timing of electricity disconnections is of particular interest, as it provides an indication of the period during which properties that remain out of use were disconnected (Figure 2). The duration of non-use constitutes a critical indicator in assessing the causes of vacancy, especially for the design of reactivation policies. It also allows for the correlation of peaks or declines in disconnections with broader changes and transformations occurring during the same periods. 14,4% of residential non-electrified properties appear to have been disconnected for more than 20 years, while 25,5% have been disconnected for between ten and twenty years.
Figure 2: Non-electrified properties by year of disconnection (1994–2025)
Source: Municipality of Athens (HEDNO data), September 2025
The increase in electricity disconnections from 2010 to 2014, peaking in 2012, is directly linked to the introduction of the EETIDE (an emergency property tax initially collected through electricity bills), as well as more broadly to the disinvestment that followed the economic crisis and the abandonment of properties by their owners due to maintenance costs or outstanding debts. The recent surge in disconnections of residential properties (2024–2025) is partly expected, as it relates to dynamics in the real estate market and to transitional processes of sale, rental or reuse.
The upward trend in disconnections of residential properties in the most recent period may also be associated with increased investment activity in central neighbourhoods of the Municipality, as well as with property accumulation processes by banks and debt management companies. Finally, the large number of disconnections recorded in 1994 does not appear to be linked to any major change during that period and may instead result from administrative handling of missing data on earlier disconnections and from the historical structure of the registry.
Mapping vacant properties by period of disconnection (Map 4) provides a longitudinal picture of the spatial concentrations of disconnections and reflects spatial tensions in urban transformation processes across different periods. The period 2010–2014 is of particular interest, as a large share of the properties disconnected during that time does not appear to have been reconnected.
Map 4: Evolution of the average number of residential electricity disconnections for the period 1995-2024 (five-year intervals) by postal code
In Map 5, postal codes shaded in red represent areas with a Location Quotient (LQ) above 1 (i.e. above the municipal average), indicating areas with a higher rate of reconnection of non-electrified properties during the period 2024–2025. This may be associated with more intense activity in property transfers, renovations and changes of occupants. By contrast, the city centre and the western neighbourhoods appear to exhibit slower rates of reconnection (shaded in blue), as do areas that may have experienced more intense activity in previous years, such as Koukaki and Petralona. More robust conclusions will be possible after several years of consistent data extraction and comparative analysis.
Map 5: LQ change 2024–2025
Source: Municipality of Athens (HEDNO data), September 2025; ELSTAT 2021
The distribution of residential non-electrified properties by construction period (Table 9) differs from the ELSTAT data (Table 4). One in four dwellings out of use appears to have been constructed before 1960, and a similar proportion was built during the period 1981-2010, while in the period 1961-1980, which accounts for 70% of vacant dwellings according to the 2021 Census, 46% of residential non-electrified properties were constructed. This divergence reflects the difference between dwellings classified as vacant in the census, which may involve occasional or other forms of use, and actual non-use as indicated by the absence of electricity connection. Errors or incomplete reporting in the HEDNO registry should also not be excluded.
Table 9. Construction period of residential non-electrified properties
Source: Municipality of Athens (HEDNO data) September 2025, ELSTAT census 2021
Map 6: Construction period of residential non-electrified properties by Municipal Community
Source: Municipality of Athens (HEDNO data) September 2025, ELSTAT census 2021
Finally, properties that are effectively out of use appear to have a higher proportion of units below 50 sq.m. compared to the ELSTAT distribution, confirming the assumption that these are more likely devalued dwellings located in basements and on lower floors.
Table 10. Size of residential non-electrified properties
Source: Municipality of Athens (HEDNO data) September 2025, ELSTAT census 2021
Methodological Notes and Conclusions
The complementary use of the two methods for estimating the vacant stock -the ELSTAT census and the proxy indicator of non-electrification from the HEDNO registry- highlighted the differentiated geographies, characteristics and dynamics shaping vacancy in the municipality of Athens, as well as the interpretative limitations of each dataset. Vacancy levels in Athens do not correspond to the figures often invoked in political and media discourse; nevertheless, they remain substantial even under the minimum estimate provided by non-electrification data. Vacant dwellings are predominantly small- or medium-sized and of considerable age (over 50 years). A significant proportion remains vacant for extended periods (20% for more than 15 years), while further investigation is required for properties that exited use during the economic crisis and remain inactive (20%), as well as for the high share of vacant dwellings of more recent construction (27% built after 1980).
Census data also require more systematic analysis regarding categories of non-occupied dwellings that do not constitute a primary residence or do not serve residential use, as these may represent a potential field of intervention to increase the availability of regular housing. Vacant commercial properties are likewise of interest, although they were not examined in depth in this article. Enriching the analysis through cross-referencing with other data sources (tax declarations, cadastre, water supply records), combined with targeted qualitative and field-based research, would contribute to a better understanding of ownership structures, property conditions and their potential for activation.
The establishment of local monitoring mechanisms, such as a Housing Observatory, and non-profit management structures, such as social rental services, constitutes a necessary precondition for the socially beneficial reactivation of vacant properties. By contrast, unconditional subsidies and tax exemptions granted to private owners tend to reinforce market pressures without delivering socially and spatially just housing outcomes.
Acknowledgements
This article forms part of the outputs of the SEDE [10] research project (funded by HFRI). Part of the data was collected within the framework of the preparation of the Housing Strategy of the Municipality of Athens. Warm thanks are extended to Stavros Spyrellis for the production of the maps, as well as for his valuable support and patience, and to Georgia Thymoglou for her helpful clarifications regarding the census data. The english translation has been assisted by AI.
[1] Indicatively: Ευρωπαϊκό Σχέδιο Οικονομικά Προσιτής Στέγασης, Housing Advisory Board recommendations to the EC, Repurposing Vacant Spaces into Homes.
[2] Other potential sources, such as data from the tax authority, cannot at present be utilised with sufficient reliability, as property income tax declarations (E2) and property ownership declarations (E9) do not include identifiers for unique properties, but rather record taxpayers’ ownership rights over them. The possible establishment of a unified Property Ownership and Management Registry, recently announced, could provide a more comprehensive picture of vacancy.
[3] In the most recent census, conventional dwellings are classified as either occupied or vacant. Vacant dwellings are further distinguished into holiday homes (conceptually including also short-term tourist rentals), secondary residences (used systematically on an occasional or seasonal basis), dwellings for rent, for sale, for demolition, or vacant for other reasons. The latter category indicatively includes cases of complete abandonment, non-electrification, or intended future use by family members.
[4] The large number of dwellings recorded as available for rent does not correspond to the supply of housing advertised on listing platforms (e.g. on 17/12/2025, 7.591 dwellings were listed for rent on spitogatos.gr and 8.355 on indomio.gr). Despite the time elapsed since the census, this raises questions regarding the types of properties included in this category. It is possible that short-term rentals were inadvertently recorded under this heading, although according to the Statistical Authority they formally fall within the category of holiday homes. This assumption is further supported by the very low number of holiday homes recorded in 2021.
[5] Transitional or temporary non-use (frictional vacancy) refers to dwellings that are on the market for sale or rent and is considered normal, as it is linked to the functioning and mobility of the market and to time lags between changes of occupants (typically estimated at 3-6%). By contrast, structural vacancy refers to dwellings that remain outside the market for longer periods, due to ageing or obsolescence, extensive renovation, ownership or institutional constraints, speculative strategies, or lack of interest on the part of owners. A further category is occasional vacancy, primarily associated with secondary residences and tourism (FEANTSA 2016:5)..
[6] This development is also reflected in the significant increase in the indicator of dwellings per 1.000 inhabitants, which rose from 468 in 1991 to 679 in 2021 (one of the highest values among OECD countries, OECD 2024, ΗΜ1.1. Housing stock and construction),this trend points to an overproduction of housing relative to actual housing needs, reflecting the central role of construction activity in shaping Athens’ economy within the broader national development model.
[7] The data used in this article were extracted in September 2024 and September 2025. This allows for an initial longitudinal analysis of the rate of change of non-electrified properties; however, more robust conclusions require longer-term monitoring.
[8] Residential electricity connections in 2025 (508.984) significantly exceed the number of conventional dwellings recorded by ELSTAT in 2021 (437.188), with a difference of 71.792 units. The reasons for this discrepancy are not entirely clear: connections registered as residential may not correspond to actual residential use and therefore may not be recorded in the census, while some dwellings may have more than one residential connection. Interpreting this difference requires further investigation. In the analyses that follow, ELSTAT data are used as the reference base for the housing stock.
[9] During the first nine months of 2025, 11.256 requests for electricity disconnection of residential properties were recorded, representing an increase of 120% compared to the 5.115 disconnection requests recorded in 2024. In the analyses that follow, the disconnections of 2025 have been excluded.
[10] Research project “Social Divisions and Deprivation in Athens 2011–2021” (SeDe). Funded by the Hellenic Foundation for Research and Innovation (HFRI) under the call “Funding of Basic Research (Horizontal Support for All Sciences), National Recovery and Resilience Plan (Greece 2.0),” and implemented by the National Centre for Social Research (EKKE). (Scientific Coordinator: S. N. Spyrellis). https://www.sedeproject.eu
Entry citation
Siatitsa, D. (2026) Vacant dwellings in the Municipality of Athens: spatial dynamics, methodological challenges and reactivation policies to address the housing crisis, in Maloutas T., Spyrellis S. (eds) Athens Social Atlas. Digital compendium of texts and visual material. URL: https://www.athenssocialatlas.gr/en/article/κενές-κατοικίες-στον-δήμο-αθηναίων/ , DOI:
Atlas citation
Maloutas T., Spyrellis S. (eds) (2015) Athens Social Atlas. Digital compendium of texts and visual material. URL: https://www.athenssocialatlas.gr/en/ , DOI: 10.17902/20971.9
References
- Αράπογλου, Β., Σιατίτσα, Δ. (2019). Πολιτικές αξιοποίησης κενών κτιρίων και κατοικιών. Στο Ν. Κουραχάνης (Επιμ.), Κατοικία και κοινωνία. Προβλήματα, πολιτικές και κινήματα (201–225). Διόνικος
- Αράπογλου, Β., Μαλούτας, Θ., Σιατίτσα, Δ. (2019). Κενές κατοικίες: Ένας πόρος για την κοινωνική πολιτική κατοικίας και την τοπική ανάπτυξη στην Αθήνα. Γεωγραφίες, 33, 52-64.
- Μαλούτας, Θ. (2000). Αστικοποίηση και κενές κατοικίες. Στο Μαλούταςμ Θ. (Επιμ.), Κοινωνικός και Οικονομικός Άτλας της Ελλάδας. Οι πόλεις (σσ. 24–25). ΕΚΚΕ, Gutenberg, Πανεπιστημιακές Εκδόσεις Θεσσαλίας.
- Μαλούτας, Θ., Σπυρέλλης Σ.Ν. (2016). Κενές Κατοικίες. Στο Θ. Μαλούτας & Σ. Σπυρέλλης (Επιμ.), Κοινωνικός Άτλαντας της Αθήνας.
- Τριανταφυλλόπουλος, Ν. (2015). Το κτηριακό απόθεμα του κέντρου της Αθήνας, Κοινωνικός άτλαντας της Αθήνας.
- Μπελαβίλας, Ν., Πρέντου, Π. (2015). Τα εγκαταλελειμμένα κτήρια και τα ξενοίκιαστα εμπορικά καταστήματα: Το χωρικό σχήμα της κρίσης, Κοινωνικός άτλαντας της Αθήνας.
- Χατζηπροκοπίου, Π., Καλογερέσης, Αθ. (2023). Kενές κατοικίες και χωροκοινωνικοί μετασχηματισμοί στη Θεσσαλονίκη. Γεωγραφίες, 41, 23-39.
- Χατζηπροκοπίου, Π., Μάγγου, Η., Σιατίτσα, Δ. (2024). Προσεγγίζοντας τις κενές κατοικίες στο Δήμο Θεσσαλονίκης. Κοινωνικός Άτλας Θεσσαλονίκης.
- Χατζηπροκοπίου Π., Καραγιάννη Μ., Βράντσης Ν., Μάγγου Η., Σιατίτσα Δ., Ozgunes Μ., Σεφεριάδου Π. (2025) Εκτίμηση κτιριακού αποθέματος προς αξιοποίηση σε προγράμματα κοινωνικής και οικονομικά προσιτής κατοικίας στον Δήμο Θεσσαλονίκης. Παραδοτέο έρευνας.
- Caramaschi, S., Chiodelli, F. (2022). Reconceptualising housing emptiness beyond vacancy and abandonment. International Journal of Housing Policy, 23(3), 588-611.
- Dimitrakou, I. (2021). A sense of absence: Resituating housing vacancy in post-crisis Athens. Housing Studies, 37(6), 997-1014.
- FEANTSA (2016). Filling Vacancies. Vacant Real-Estate: Seizing the opportunity to find Affordable Housing Solutions in Europe. Report.
- Hoekstra, J., Vakili Zad, C. (2006). High vacancy rates and high house prices. A. Mediterranean paradox, Paper for the ENHR 2006 conference in Slovenia.
- O’Callaghan, C. (2023). Rethinking vacancy within the urbanization process: towards a new research agenda. Urban Geography, 45(5), 863-882.
- Vrantsis, N. (2025). Financialization, possessive familialism, and the politics of vacancy: How vacancy became Greece’s most lucrative housing strategy, Radical Housing Journal, 7(1).


