The spatial and social footprint of the energy saving program “Eksikonomisi Kat’ Oikοn”
Christoforaki Katerina
Built Environment, Economy, Housing
2018 | May
As part of Greece’s compliance with European Union rules on energy saving and the reduction of emissions of pollutants into the atmosphere, a number of actions have been implemented. The energy upgrading of the building stock is a major concern. In order to facilitate investing in this purpose, a range of incentives are provided to property owners. The “Eksikonomisi Kat’ Oikon” program is one of these and consists of subsidy support. The first implementation was completed at the end of 2015, and the second round is actually starting. The effective use of resources is of great importance for the substantial reduction of the energy footprint of the building stock.
This paper explores the spatial, social and economic significance of the program through the analysis of available data on the involvement of beneficiaries, which have not been used before. Its impact on the energy upgrading of buildings in Metropolitan Athens – i.e. almost the entire Attica Region – is being identified and evaluated. Individual economic categories of beneficiaries, defined by the Program Guide, and their access to the program’s resources are assessed, as well as the distribution of resources and upgraded properties by regional unit in respect to needs inferred by the age of the housing stock in each unit. Finally, the distribution of resources to commercial activities and occupational categories is evaluated through the breakdown of resources invested in distinct program actions.
Data processing procedures highlight the problematic points of the process along with the essential needs for energy upgrading.
Methodology
The intense urbanization in the post-war period, the pressure of the landowners, the special housing policy and the relaxed urban planning policy have resulted in the often fragmented and unequivocal constitution of the urban fabric in the metropolitan region (Μαντουβάλου, Μαυρίδου 1993). The result of the low requirements of building regulations, their lack or even their circumvention was – among other things – low building standards and high energy consumption (Σαρηγιάννης 1978).
In the process of upgrading the built-up stock, a series of actions are encouraged either concerning the shells of buildings or their mechanical installations. “Eksikonomisi Kat’ Oikon” is designed to finance part of the energy renovation cost of residential buildings in areas with an official cost price of up to € 2,100 per square meter. Its first implementation lasted from 2011 to 2015, and the second round of the program was launched in early 2018.
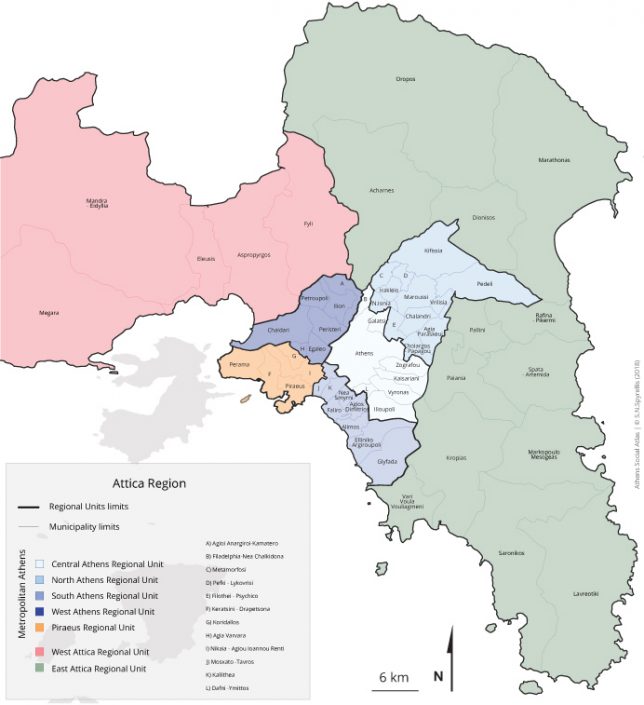
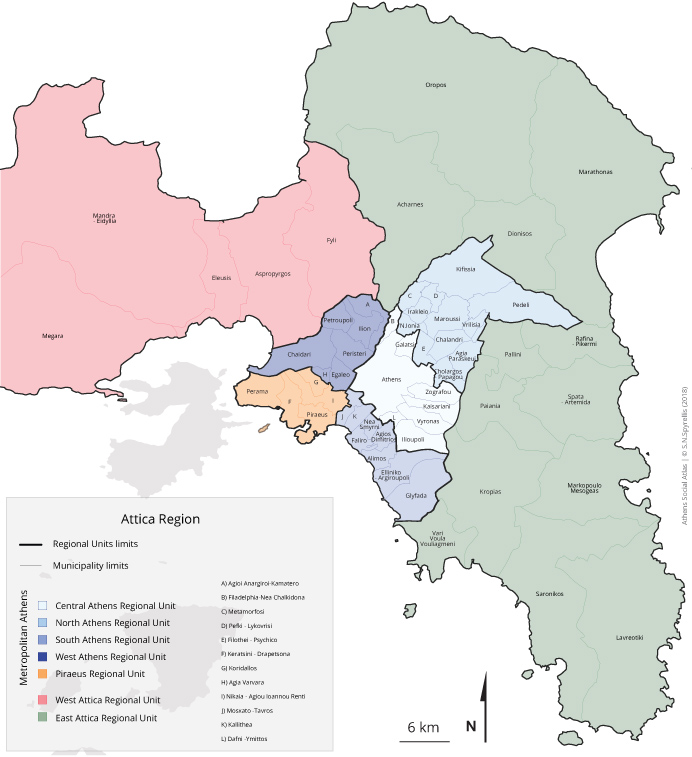 Map 1: The administrative division of the Attica Region
Follows an evaluation of the interest expressed by beneficiaries and of resources allocated by the program throughout the Region of Attica (Map 1). The evaluation reveals the imprint of the project, showing the residential areas that require upgrading, both at the level of Regional Units (RUs) and municipalities and, at the same time, the buildings that qualified according to the program’s criteria. In terms of the social effect of the program, we explore the distribution of income categories of beneficiaries within Metropolitan Athens. These categories are defined on the basis of individual or family income as stipulated in the program guide. Further exploration of the available data led to depicting the allocation of resources in terms of eligible expenditure, which are specific actions we refer to as “intervention”. Specific groups of professionals benefited from these interventions, stimulating the Greek market accordingly. Finally, this examination identified a number of problems in terms of the social and professional groups involved as well as in terms of the implementation in respect of the program’s objectives.
The profile of the property owners who benefited from the program, as well as their funding, are openly accessible data, posted by the National Entrepreneurship and Development Fund (ETEAN). The data presented subsequently resulted from the processing of raw and so far untreated information, which was categorized and analyzed for the needs of this presentation.
The allocation of resources per region and the social groups that gained access to the program’s funding per region are presented in maps and diagrams. In addition, the breakdown of funding by type of intervention/action makes it easier to understand what part of the market has been stimulated and to what extent.
Distribution of beneficiaries at Municipality and Regional Unit level in Attica
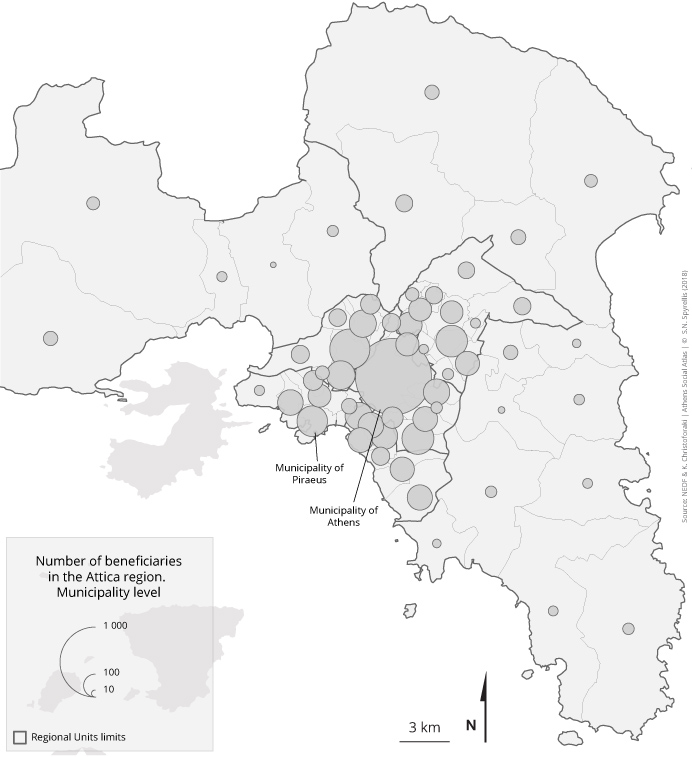
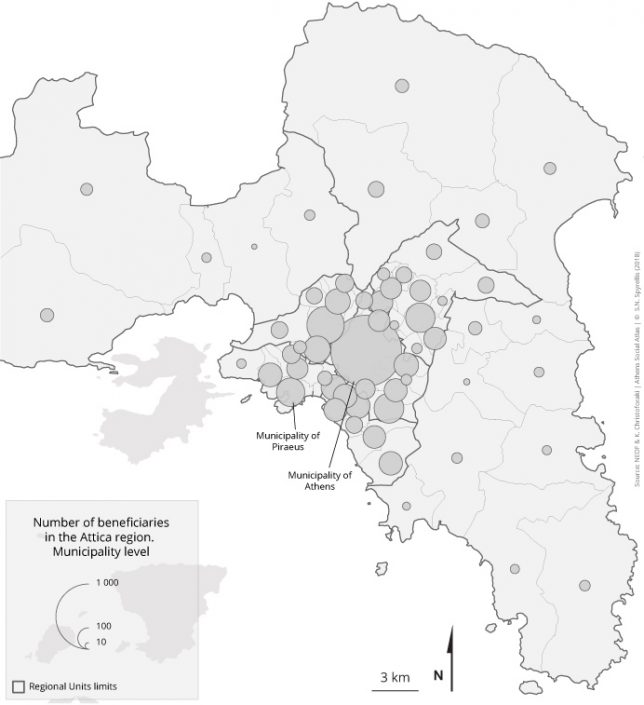
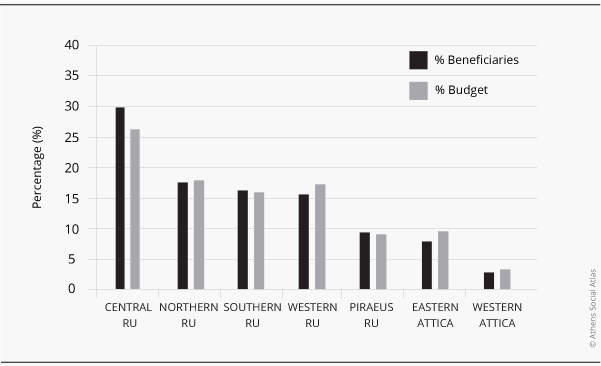
All beneficiaries were grouped together by municipality and their distribution is shown in map 2, while their percentage per Regional Unit is presented in graph 1. Beneficiaries, according to the income criteria set by the program, are divided into three categories of subsidy. The first (with the lowest income) absorbed 70% of the expenditure, the second one 35% and the third 15%.
Map 2: Distribution of the number of beneficiaries per municipality in the Region of Attica
Data source: ETEAN, author’s processing
The bulk of beneficiaries’ interest is concentrated in the inner part of the region – that is, in the Attica RUs , excluding Eestern and Western Attica – which accounts for 87% of the applications. This percentage, however, is less than the specific weight of the population in this part of the region, which is 93% according to the 2011 census (EKKE- ELSTAT 2015). Within this inner part of the region, 30% of beneficiaries are located in the Central Sector, which also falls short of its specific population weight (35.5%). On the contrary, the percentage of applications was higher than the population weight in the Northern and the Western Sectors; it was about equal in the South Sector and much less in Piraeus (9% of applications vs. 12.7% of the population) despite the large number of old age buildings the latter includes. The East Attica regional unit, an area with a much more recent residential development and less densely built, received a much higher percentage of applications compared to its population (8% vs. 5.4%). regarding the distribution of funds (Graph 1), the differences observed are in the same direction. Eastern Attica and Piraeus, for example, absorbed 10% and 9% respectively of the total funds of the program for Attica despite their very unequal population size (5.4% vs. 12.7%).
Graph 1: Beneficiaries and allocation of resources per Regional Unity (RU) in Attica
 Data source: ETEAN, author’s processing
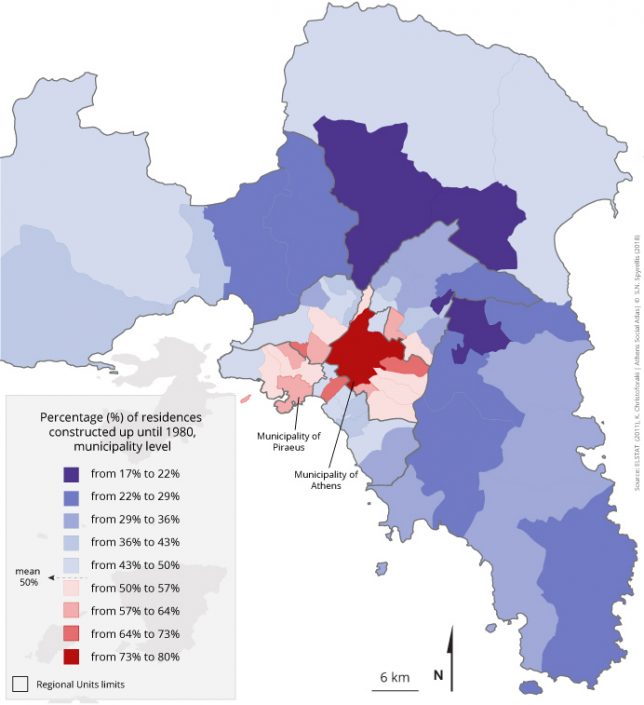
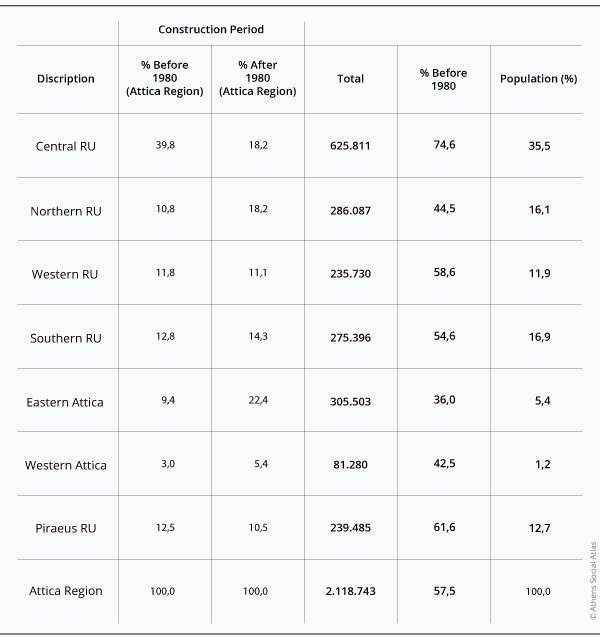
From the population census of 2011 of the Hellenic Statistical Authority (ELSTAT), we use the data on the building stock in the Region of Attica (Table 1). The buildings that were constructed before 1980 -i.e. before the Thermal Insulation Regulation of Buildings (1979)- are, presumably, the most in need for energy upgrading. Following Table 1, the largest needs are concentrated in the Central Sector, where approximately 40% of the old buildings of the region are concentrated, and then in the Southern Sector and Piraeus, which comprise 25% of the relevant stock.
Table 1: Number of residences by construction Period and Regional Unit (RU) (2011)
 Source: EKKE-ELSTAT (2015)
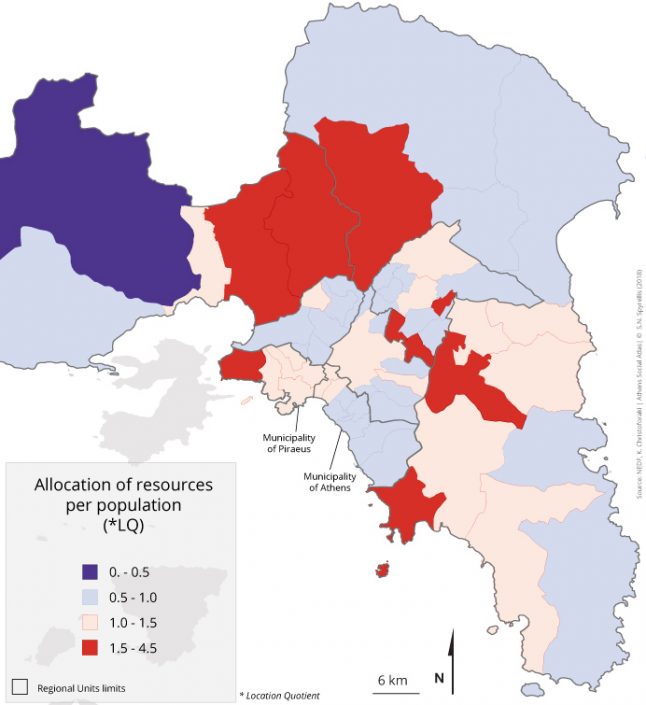
Therefore, the comparatively increased number of applications and provision of funds in the Eastern Attica RU may be considered a failure in relation to the initial goals of the program, as far as the fair socio-spatial distribution of the subsidies is concerned. Moreover, considering the findings of Maps 3 and 4, there is a clear discrepancy between the concentration of upgrading needs in central municipalities and the concentration of beneficiaries in more peripheral ones.
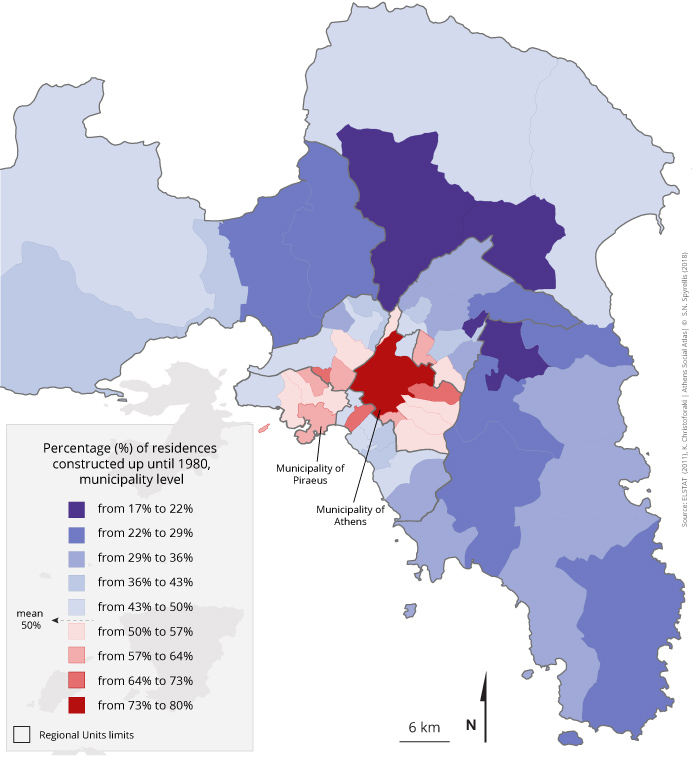 Map 3: Percentage of residence buildings constructed before 1980 in the municipalities of the Attica Region
Data source: EKKE-ELSTAT 2015
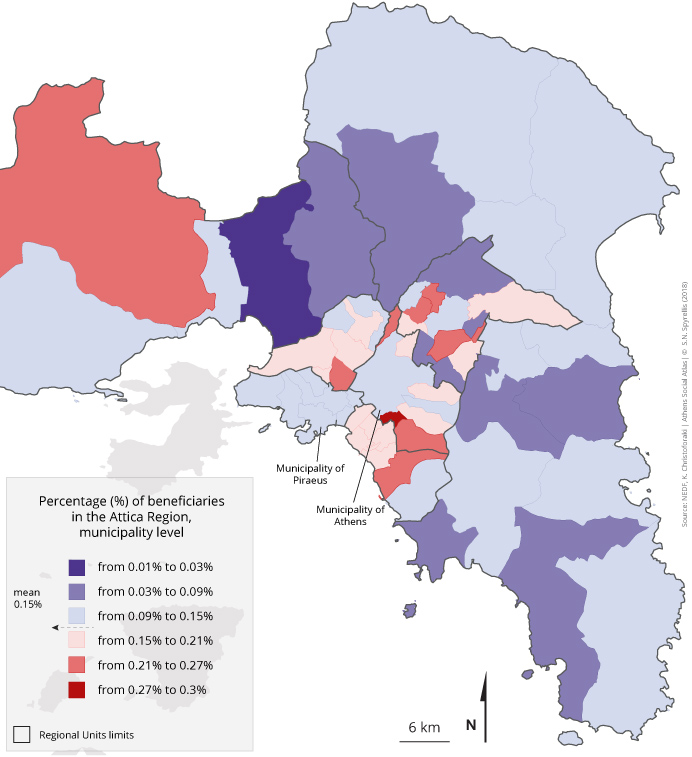 Map 4: Percentage of beneficiaries per number of residents in the municipalities of the Attica Region
Data source: ETEAN and EKKE-ELSTAT 2015
Building stock upgrade index
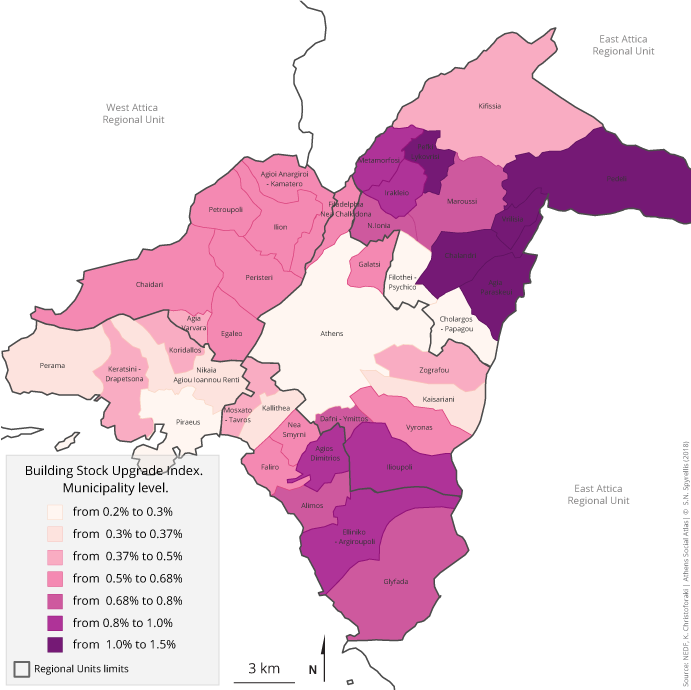
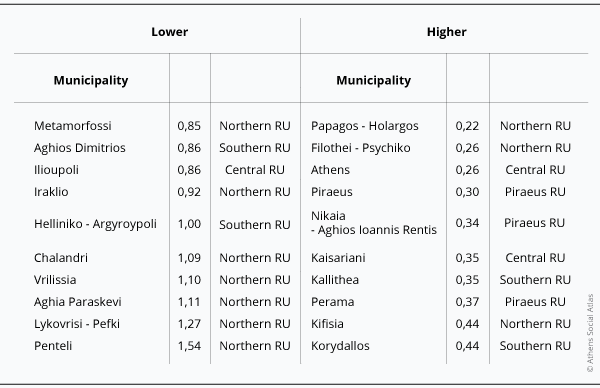
The impact of this energy saving program per municipality was sought using the available data. The “Upgrade Index” approximates this impact by dividing the number of upgraded buildings through the program by the total number of buildings per municipality, which potentially need upgrading (constructed before 1980).
Table 2: Municipalities of the Attica Region with the highest and lowest Building stock upgrade index
 Data source: ETAAN, author’s processing
The municipalities of the Athenian metropolis present great differences regarding their building upgrading rate through the “Eksikonomisi kat’ oikon” program, as illustrated in Table 2. The Municipality of Athens shows one of the lowest indices, despite the concentration of needs presented earlier. This low performance should be related to absentee and rather indifferent landlords and to the numerous homeowners whose reduced financial means cover more pressing needs than energy upgrading. The index is close to that of the Municipality of Filothei / Psychiko, where the low effectiveness of the program was expected because almost all of its units were excluded from the program due to high level of official property values. On the other hand, the limited effectiveness of the program in municipalities such as Nikea / Renti or Perama should be attributed to the social composition of their population, dominated by strata with limited means to invest in such a project, even with a generous subsidy. Municipalities like Kaisariani and Kallithea did not benefit to the extent that would be expected following the features of their building stock, which again should be attributed to the inability of many residents to meet the financial requirements of the program. Among the municipalities of the Northern Sector, fluctuations are significant. This is due, on the one hand, to the very low indices in the Municipalities of Papagou / Cholargos, Filothei / Psychiko and Kifissia, that were largely excluded because of the high official property values. On the other hand, others municipalities, such as Penteli and Chalandri, display high indices. These municipalities benefited the most by the program, since they combine a level of official property values that do not exclude them and a mostly upper-middle and middle class population profile, who is willing and able to invest in such a program. Piraeus presents one of the lowest indices, revealing the existence of problems similar to those that explain the low performance of the program in the Municipality of Athens. Map 5 gives a comparative picture of the success / effectiveness of the program in the municipalities of the region.
Map 5: Building stock upgrade index per municipality
Data source: ETAAN, author’s processing
Types of Program Intervention and their assumed impact
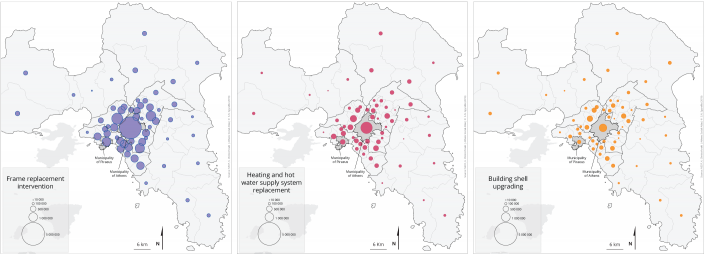
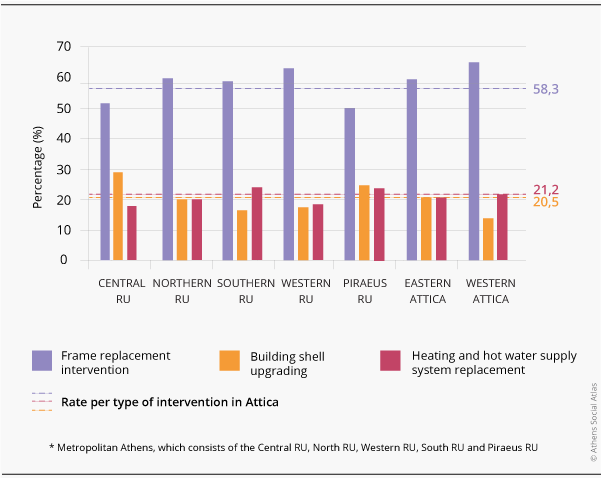
On the basis of the program’s data, the number of applications and the funds attributed to the different types of intervention and per municipality were calculated; the main conclusion is that in all RUs in Attica the allocation of funds among the three main types of intervention (replacement of window frames – wall thermal isolation – replacement of heating systems) is similar (Figure 3 and maps 6-8).
Graph 2: Percentage of applications per intervention and per Regional Unit in the Attica Region
 Data source: ETAAN, author’s processing
A total of about 60% of project funding was absorbed by the replacement of window frames, while the remaining 40% was shared almost between upgrading the building shell and replacing heating and hot water supply systems, significantly boosting the respective industries and their personnel. The impact of the program increased due to the long recession in real estate production and transactions, which was deepened by the crisis.
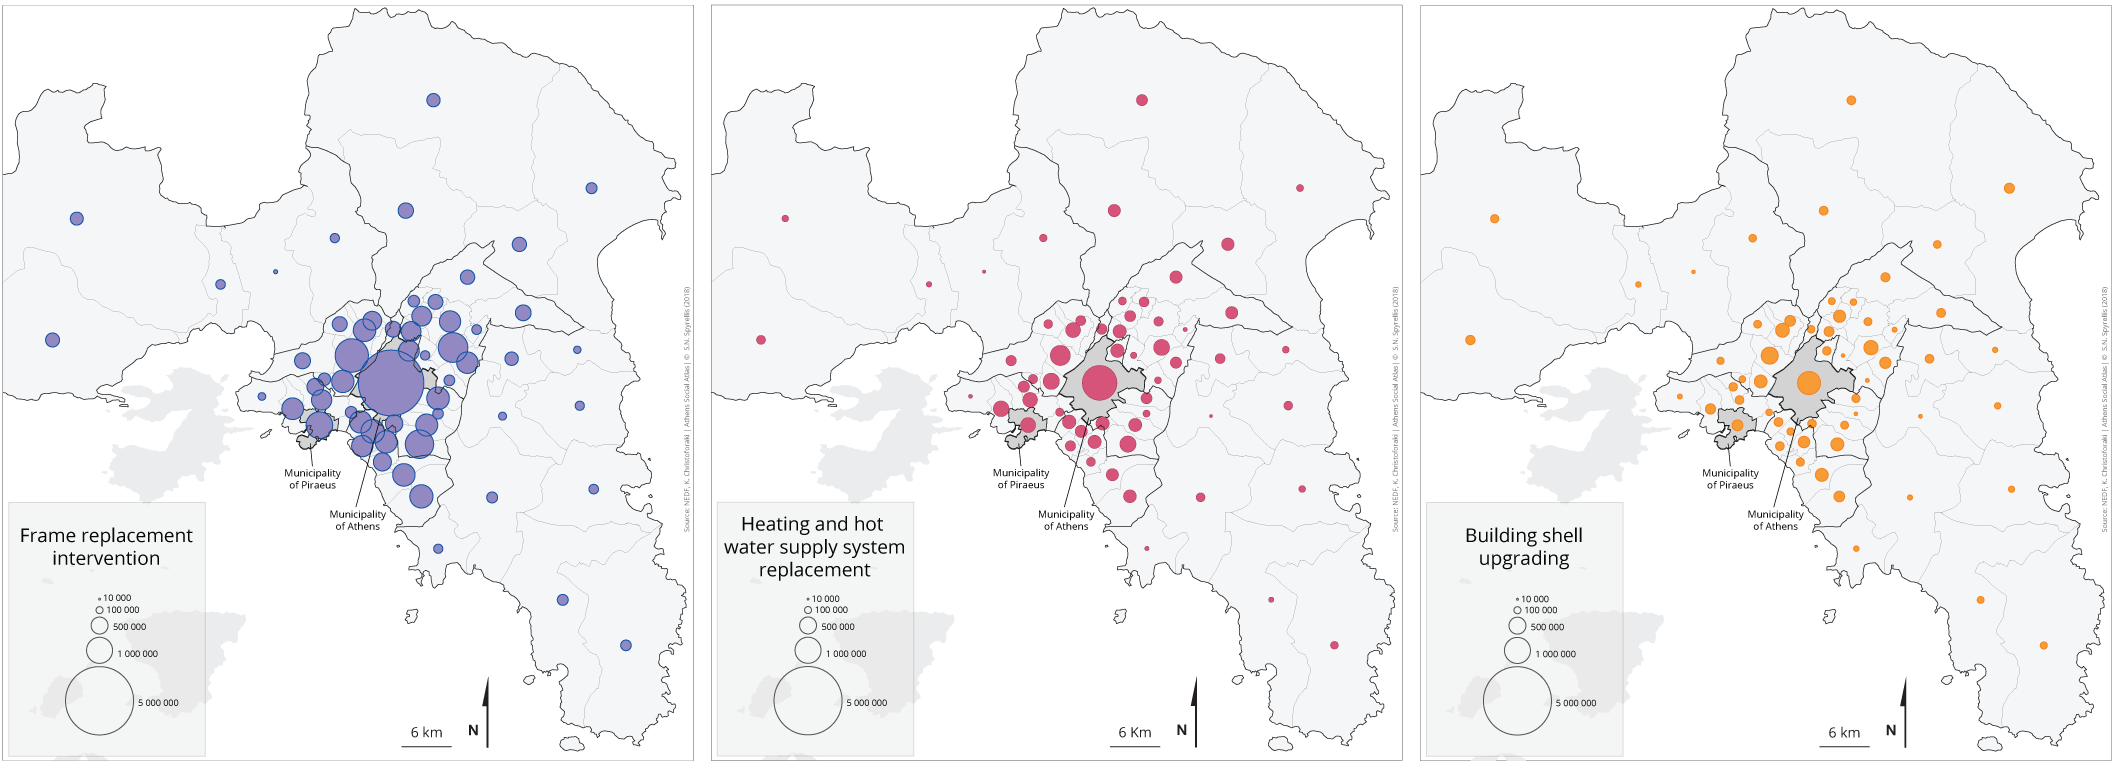 Maps 6-8: Allocation of resources per type of intervention and per municipality in the Attica Region
Data source: ETAAN
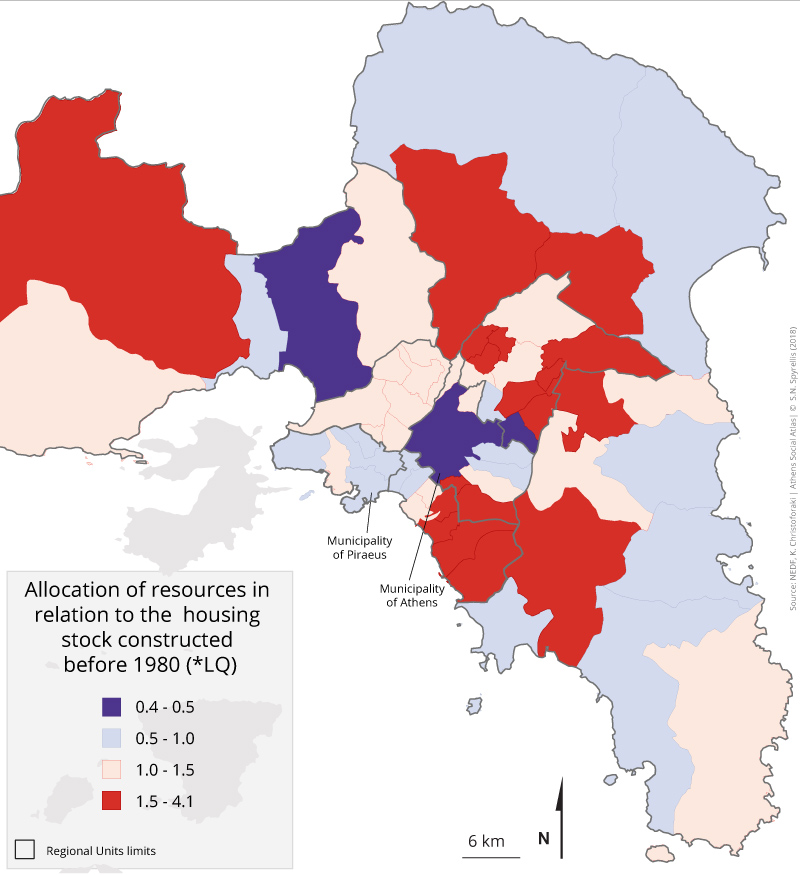
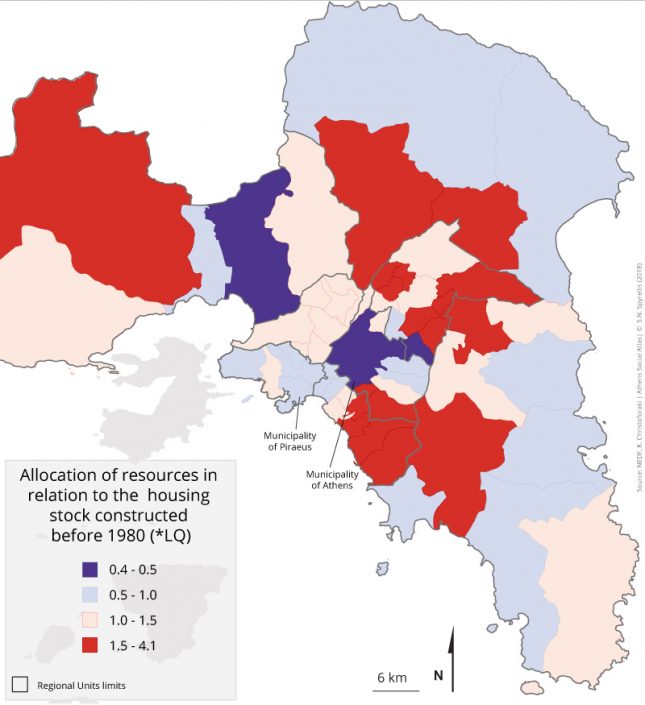
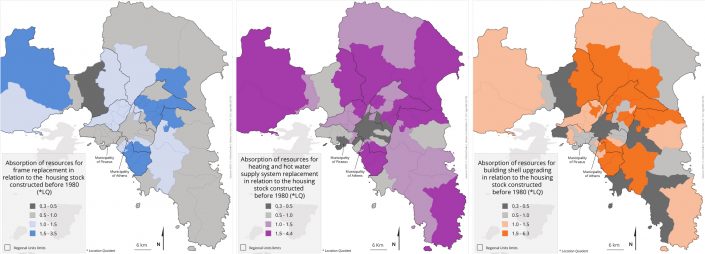
Maps 9 and 10 to 12 show the attribution of program resources – in total and by type of intervention – to each municipality in relation to the proportion of old buildings (constructed before 1980). The comparison shows that the relatively smaller attribution refers to the central municipalities with the largest population and the oldest building stock, as well as to some municipalities in the areas of Piraeus and Aspropyrgos. On the other hand, municipalities with comparatively greater attribution of funds are concentrated in semi-peripheral areas, mainly in the northeastern middle-class part of the region.
Map 9: Attribution of program resources by municipality in respect to the rate of old buildings (constructed before 1980)
Data source: ETEAN
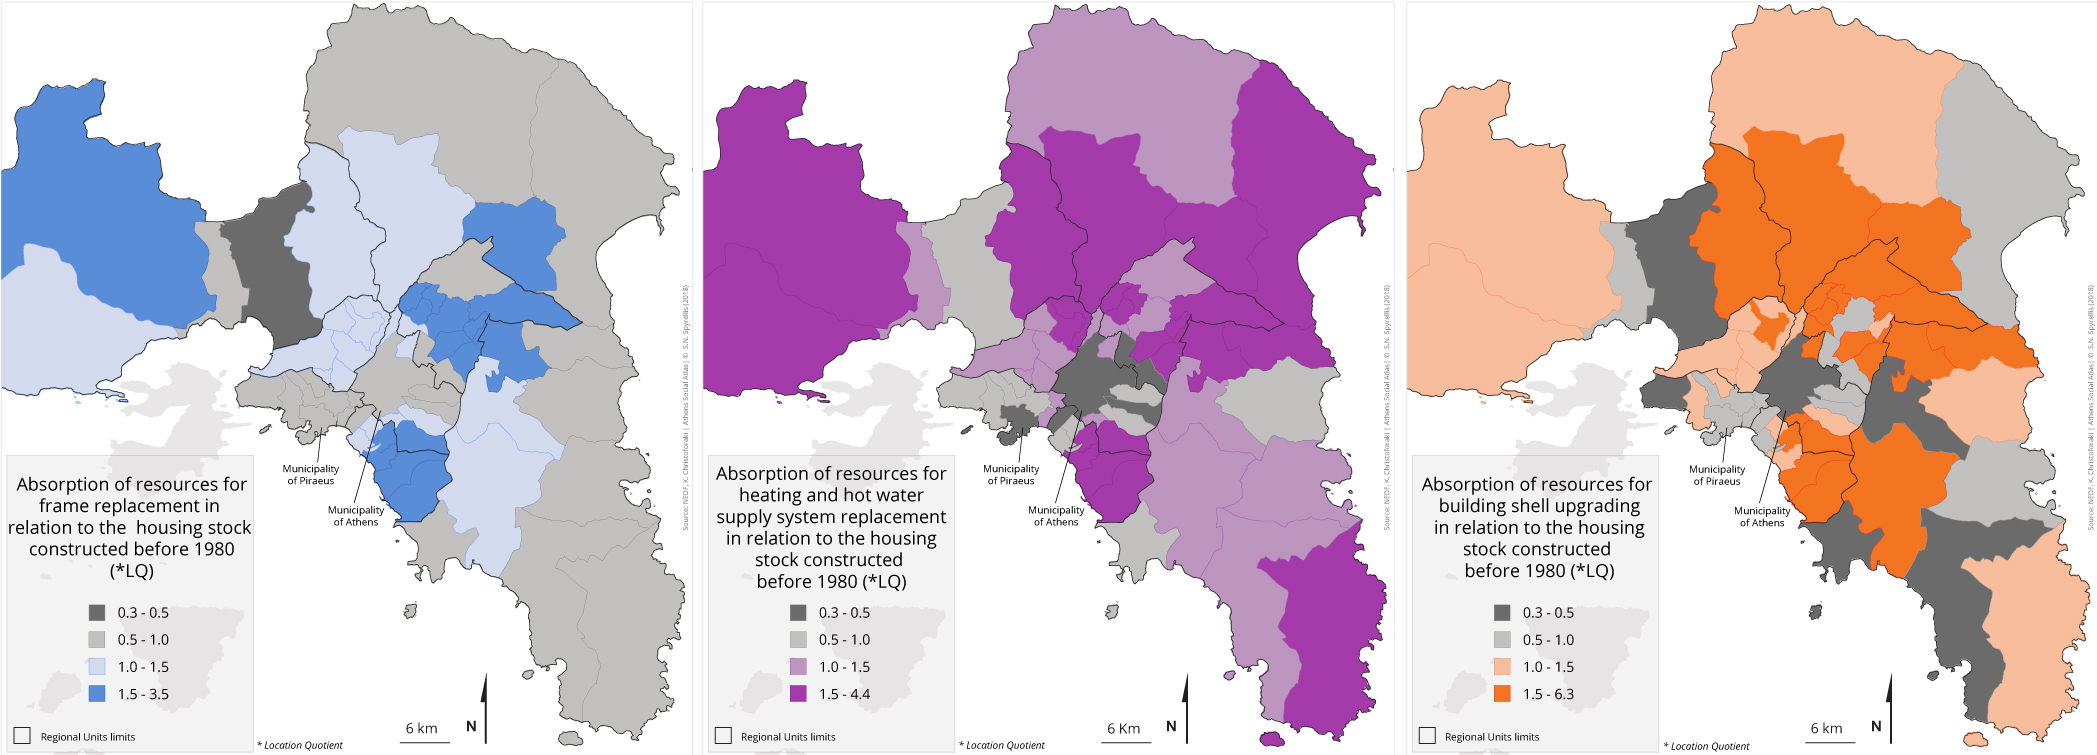 Map 10-12: Attribution of program resources by type of intervention and by municipality in respect to the rate of old buildings (constructed before 1980)
Data source: ETEAN
Conclusion
During the 5 years of the “Eksikonomisi Kat’ Oikon” program, € 396 million was spent on 50.041 approved applications. It is estimated that in the middle of the program about 1,500 applications / week were filed nationwide. 16% of the applications were submitted in the Attica Region (Taxheaven, 5/2012), which means that in Attica much less applications were submitted in respect to its population.
Despite the large number of applications, the program was rather complicated and accessible with difficulty. Beneficiaries of low income groups and, therefore, with a substantial need for subsidy, often had difficulty accessing resources and were frequently excluded. Banking institutions, acting as intermediaries between the ministry and the citizens, evaluated the applicants’ financial reliability in terms of guaranteed loan repayment criteria and the applicant could proceed only after their positive decision. Moreover, the obligatory loan provided by the program to enable the beneficiary to pay his/her part was often treated with mistrust by potential beneficiaries (see the Implementation Guide of the program).
Limited public awareness has also been an issue. The benefits of participating in the program have not been sufficiently disseminated. Pivotal was the poor information of related professionals, who were often not eager to participate. The repayment option through the bank did not provide them with the security they wanted in order to cooperate, and further hesitations were triggered by the fact that strict standards of cost, construction standards and certification procedures had to be respected. Even in the cases where merchants were actively interested to participate, they undertook in fact a professional risk. Banks rarely followed the reimbursement deadline for dealers and forced suppliers to play the role of sponsor, as they were often paid up to 7-10 months after the project was completed. This was not manageable for small local businesses because it made their function unsustainable. As a result, many of these businesses were excluded from the program.
The spatial distribution of approvals covered the entire Attica Region with some significant internal disparities. The interest per Regional Unit as well as per Municipality has revealed particularities, with typical cases being the Municipality of Athens and Piraeus, where the number of applications is much lower than expected from the large number of old buildings (constructed before 1980). Similar observations can be made about the Municipalities of Zografou and Kallithea. The interpretation of the comparatively low interest of the owners in these areas should be sought in the difficulty of a significant part of the potential stakeholders to meet the financial requirements of the program. Another possible explanation is that these are areas with the highest rental rate in the Region and where property owners show some reluctance to invest in upgrades, especially in a fairly problematic market for rented accommodation also burdened by the large number of vacant houses.
Regarding the social groups of beneficiaries, at first glance we assume that the main beneficiaries were those with the lowest income, since 56% of the applications were submitted by the lowest income category claiming 70% subsidy; 43% were submitted by the second income category claiming 35 % subsidy and only 1% of the applications were submitted by the highest income category claiming 15% subsidy. The real social impact of the program is, however, more complex than what is shown by the simple breakdown of the income tiers of the beneficiaries. Many beneficiaries may, for example, be characterized by a low income, but also be part of a network of families with greater incomes and the potential to enhance this effort energy upgrades to their property. The spatial distribution of resources and the average grant level show a privileged concentration in middle and upper-middle class areas.
Some areas are potential targets of increased interest due to the large accumulation of old building structures. For the efficient implementation of a relevant program in the future, one could initially be more thorough in identifying areas requiring urgent intervention, greater attention and possibly preferential treatment.
The way funds were distributed to different interventions shows that beneficiaries have been eager to change mainly window frames, and thus provided some positive impact to the relevant industry. However, the fact that this single option was not enough to upgrade properties to the next energy class, led to more complex applications combining different interventions and, eventually, preventing the channeling of resources into one single market.
In summary, it appears that a more full, better targeted and well disseminated information could increase the interest of the public and facilitate the participation of professionals to the energy upgrading of the building stock. At the same time, the practical problems of delays in implementation, repayment and information that create insecurity for consumers and professionals should be handled in a better way in the next rounds of the program. This will result in faster and more efficient resource attribution and wider energy upgrading. However, the problems with the implementation of the program are not limited to the issues of communication and orderly processing, as they also concern the mechanisms that systematically favor or hinder certain social groups in their decision to participate.
Entry citation
Christoforaki, K. (2018) The spatial and social footprint of the energy saving program “Eksikonomisi Kat’ Oikοn”, in Maloutas T., Spyrellis S. (eds) Athens Social Atlas. Digital compendium of texts and visual material. URL: https://www.athenssocialatlas.gr/en/article/eksikonomisi-kat-oikon-program/ , DOI: 10.17902/20971.82
Atlas citation
Maloutas T., Spyrellis S. (eds) (2015) Athens Social Atlas. Digital compendium of texts and visual material. URL: https://www.athenssocialatlas.gr/en/ , DOI: 10.17902/20971.9
References
- ΕΛΣΤΑΤ (2011) Απογραφή Πληθυσμού-Κατοικιών 2011. Κανονικές κατοικίες κατά περίοδο κατασκευής. Available from: http://www.statistics.gr/el/statistics/-/publication/SAM05/2011 (ημερομηνία πρόσβασης 15 Νοεμβρίου 2015).
- ΕΤΕΑΝ (2017) Οδηγός Εφαρμογής Προγράμματος Εξοικονόμηση κατ Οίκον. Available from: http://exoikonomisi.ypeka.gr/LinkClick.aspx?fileticket=3f2pnA6B0Vw%3D&tabid=684&language=el-GR (ημερομηνία πρόσβασης 19 Αυγούστου 2017).
- Μαντουβάλου Μ και Μαυρίδου Μ (1993) Αυθαίρετη δόμηση: Μονόδρομοςσε αδιέξοδο; Δελτίο του Συλλόγου Αρχιτεκτόνων 7: 78–108.
- Σαρηγιάννης Γ (1978) Η σύγχρονη πολεοδομική νομοθεσία σαν αποτέλεσμα της θέσεως της κατοικίας στην παιδαγωγική διαδικασία. Αρχιτεκτονικά Θέματα 12: 144–150.
- Real Estate Corner (2015) Χάρτης τιμών ζώνης Αττικής. Available from: http://www.realestatecorner.gr/el/content/48 (ημερομηνία πρόσβασης 19 Νοεμβρίου 2015).
- Taxheaven (2012) Πορεία Υλοποίησης Προγράμματος «Εξοικονόμηση Κατ’ Οίκον». Available from: http://www.taxheaven.gr/news/news/view/id/10903 (ημερομηνία πρόσβασης 19 Αυγούστου 2017).
